Gradient Boosting Trees Machine Learning Model Overview
Introduction
The aim of this research project is to perform sentiment analysis on a data set consisting of tweets. By detecting the sentiment of a tweet, we mean that we want to know if a tweet is interpreted as being “positive” or “negative”. Through the utilization of tools in Apache Spark, we hope to be able to create a classification model that is able to automatically interpret the sentiment of a tweet and accurately classify a given tweet.
Apache Spark is used to extract patterns and knowledge from large data sets. This is a cutting-edge area in computer science and has garnered a lot of recent interest with the large amounts of data being generated. Apache Spark is highly effective in this context, due to it being significantly faster than previous tools such as MapReduce. This is due to the in-memory data processing. It’s also easier to use as it has a large number of high-level operations. Finally, Spark’s Machine learning library (MLlib) provides multiple learning algorithms and utilities which are a huge asset for this project. This study focuses mainly on applying sentiment analysis with Apache Spark to social media data. The purpose of the report is to implement sentiment analysis on a set of social data and apply machine learning to gain meaningful insights. The results of sentiment classification can be utilized to filter and sort the data into positive and negative opinions.
We use Gradient Boosting Trees machine learning algorithm to get our predictive output. When compared to individual decision trees or other machine learning methods, GBT often offer great predicted accuracy. The model can capture complicated correlations in the data and produce more accurate predictions by sequentially integrating numerous decision trees.Gradient Boosting Trees don’t require intensive data preprocessing to accommodate a variety of feature types, such as numerical and categorical. They are therefore adaptable and appropriate for a variety of datasets.
When comparing Gradient Boosting Trees to other sophisticated models such as deep neural networks, they are less likely to overfit. Gradient Boosting Trees are good at handling outliers and noisy data. Compared to single decision trees, the model is typically more resilient to noise and outliers since it incorporates several weak learners.
Methodology
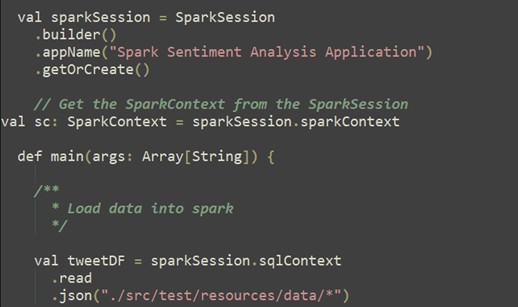
Data Loading: Spark Session Creation
A Spark session (sparkSession) is created using SparkSession.builder() to configure session properties like the application name. The sparkSession is used to create a DataFrame (tweetDF) by reading JSON files from a specified path (“./src/test/resources/data/*”) and the read.json method is used to read JSON files into the DataFrame.
Data Inspection:
After loading, a sample of the loaded data is shown using tweetDF.show(4), displaying columns like creation time, display name, language, message content, timezone, and tweet ID. This data loading process sets up the initial data structure (tweetDF) that is then used for subsequent data preprocessing, including cleaning, labeling, and transformation for sentiment analysis.
Data Structure overview:
Upon loading, the data structure comprises several fields including:
created_time: Timestamp of the tweet created_unixtime: Unix timestamp displayname: User display name
lang: Language of the tweet
msg: Tweet message
time_zone: Time zone where the tweet was posted
tweet_id: Unique identifier for the tweet
Data Preprocessing:
Data preprocessing is usually a set of several methods that are employed to eliminate noise from data, label the data for modeling purposes and transform it into a proper format required for the modeling of machine learning algorithms.
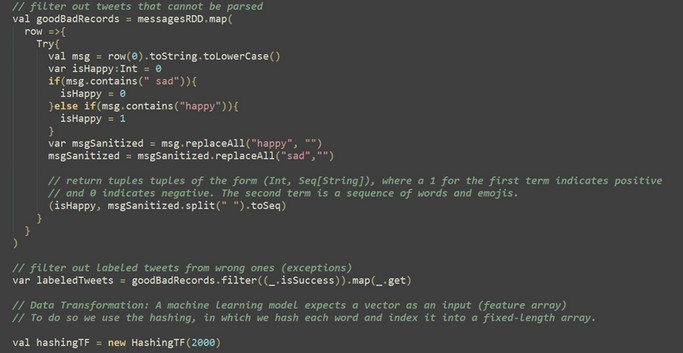
Data Cleaning: Tweets are filtered to include only those containing specific keywords (“happy” and “sad”). Equal numbers of happy and sad tweets are selected to prevent bias in the model.
Data Labeling: Tweets are labeled based on the presence of keywords: Tweets containing “happy” are labeled as positive (1). Tweets containing “sad” are labeled as negative (0).
Data Transformation:
Text data is transformed into numerical features using HashingTF from MLlib: Words in each tweet are tokenized and converted into a sequence, the sequence of words is transformed into a fixed-length numerical vector using hashing.
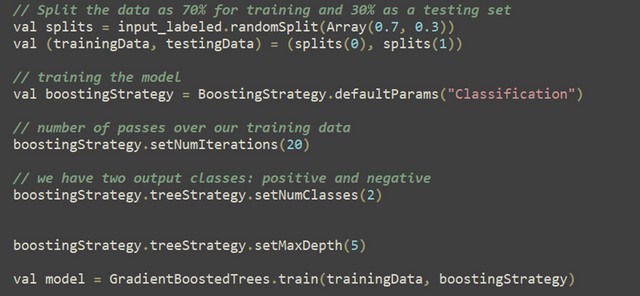
Model Splitting:
The labeled data is split into training and testing sets (70% training, 30% testing). A boosting strategy is defined (BoostingStrategy) for Gradient Boosted Trees (GBT). Parameters such as number of iterations (setNumIterations), number of classes (setNumClasses), and maximum depth (setMaxDepth) are set. The GBT model is trained using GradientBoostedTrees.train with the specified boosting strategy and training data. Typically, after training, the model’s performance is evaluated on the testing set to assess its accuracy, precision, recall, etc. The trained model is saved to disk using model.save(sc, “./model/”) for later use or deployment.
Model Training:
For model training we have used the Gradient Boosting algorithm, utilizing the Gradient Boosting algorithm for sentiment analysis offers a robust approach to predictive modeling. By sequentially refining predictions through ensemble learning, Gradient Boosting adapts well to complex sentiment patterns, resulting in accurate sentiment classification. Its ability to handle nuanced relationships within data makes it a preferred choice for sentiment analysis tasks, ensuring reliable and effective sentiment predictions.

Predictions:
After a training, the model is taken into action to calculate the mood of the tweets. The evaluation of the model is carried out through comparing the predictions made by the model against the actual labels in the test dataset that not only highlight the performance of the model but also the efficiency of training procedure.
Model Exportation:
Then validated and machine learning parameters tuned, the trained model becomes ready to be deployed for product use, for example, in a Spark Streaming workflow for real-time sentiment analysis. This makes the feature serviceable for all those applications that demand prompt response which covers the area of dynamic customer service tools and the real-time social media tracking.
Results and Analysis
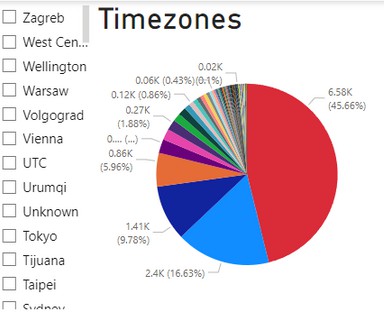
The below pie chart shows the distribution of user time zones, with the ‘Pacific Time (US & Canada)’ timezone accounting for 16.63% of users. ‘Eastern Time (US & Canada)’ and ‘Central Time (US & Canada)’ are the second and third largest segments, respectively. Other global time zones are represented by smaller segments. The percentages and actual counts provide insights into the geographical diversity of the user base.
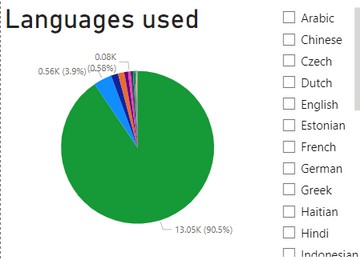
The pie chart below illustrates the languages used by users, with English being the dominant language, constituting 90.5% of the data. Other languages like Japanese, Tlingit, and Spanish are represented by a smaller fraction, indicating that the user base is primarily English-speaking.
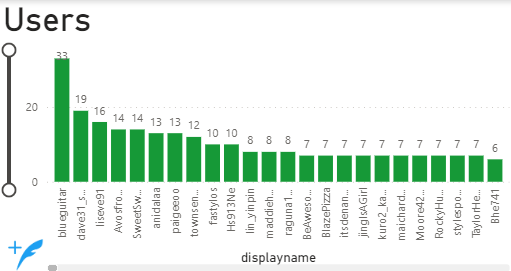
The bar graph displayed below shows the number of messages sent by individual users, with ‘blueguitar’ leading with 33 messages, followed by ‘dave31_sam’, ‘’liseve91’, and ‘AvosfromMexico’. This graph offers a quick visual representation of the most active users in the dataset.
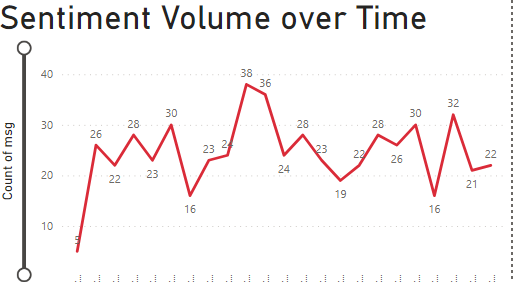
The line graph depicts the fluctuations in sentiment volume over time, marked by specific dates and times. The highest point reached 38 messages at a particular time, indicating a surge in user engagement, while the lowest points suggest periods of lesser activity or less intense sentiment expression.
Overall, the dashboard combines temporal and linguistic data with user engagement and sentiment analysis, offering insights into when and how users are interacting. This information can be valuable in understanding peak activity times, predominant languages, and overall user sentiment, which can inform content strategies, targeted marketing, and customer service operations.
The dashboard presents a sentiment analysis of a dataset that includes 1,000 textual entries. The sentiment analysis is broken down into positive and negative categories, which are represented through three distinct visual elements.
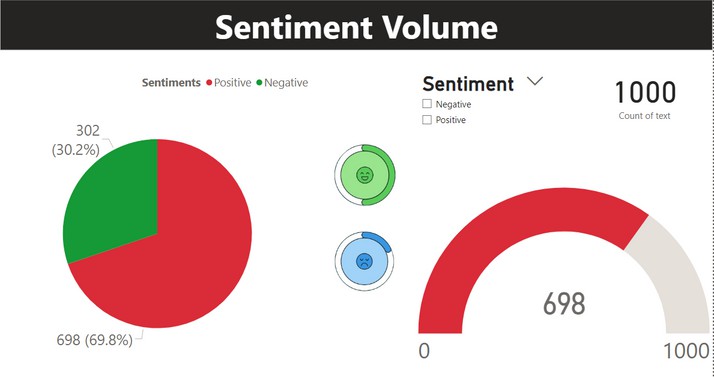
The pie chart shows the proportion of positive versus negative sentiments in the dataset. The larger, red section represents 698 entries (69.8%) with a positive sentiment, while the smaller, green section represents 302 entries (30.2%) with a negative sentiment. This contrast allows for an immediate understanding of the overall sentiment tendency in the dataset, indicating a predominant positivity.
The gauge serves as a progress, illustrating the total count of positive sentiments out of a maximum of 1,000 texts. The indicator is predominantly filled in red, indicating that most texts have a positive sentiment. The unfilled portion, represents the remaining volume up to the maximum that would represent negative sentiments.
Conclusion
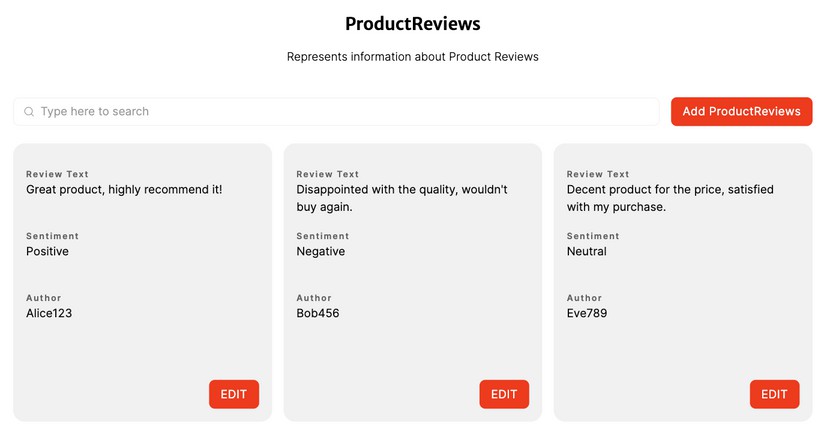
Utilizing the visualizations as discussed above, we propose an analytics application which helps companies understand the positive or negative sentiment associated with their products. Product reviews from twitter can be processed through our algorithm of sentiment analysis and appropriate visualizations can be produced in order for companies to make decisions on improvements on the product, which geolocation or languages should be targeted, any specific customers they can provide special rewards or deciding what time to be used for marketing and advertisement campaigns.
The goal of the analytics dashboard app is to provide companies with insights from their customers’ product reviews that may affect how consumers perceive products. Companies often wonder how consumers feel about their products and the features of their products. Features of specific interest to companies are identifying the positive and negative features of products, what other products consumers are comparing their product to, and whether the company is having a greater positive or negative impact on consumers compared to their competitors.
Helping advertisers decide which location is more profitable for them to target, which language their marketing campaign should be in or which time is most suitable for them to buy these ad-spaces are all important decisions which can drive business revenue and growth, and our analytics app can help companies achieve that.
Real time bidding is a process through which companies buy ad space on websites, social media industry. The companies bid on ad-space on cost-per- thousand impression basis. The visualizations through our application can help the companies narrow down the segments where they want to market their products.
To demonstrate the functionality of the app and dashboard, we use Twitter data to show how the app processes data to provide companies with quick and easily interpretable results. Consumers often provide feedback on Twitter, especially in the form of tweets. It therefore may be beneficial for companies to know the sentiment of tweets about their products with respect to the overall sentiment of the product. A summary of many product tweets using product features is also of interest to companies as they want to know what consumers think about specific features of their product. Finally, comparing consumer tweets about their product to that of their competitors can provide companies with an idea of how they are stacking up against competition. The dashboard will provide these insights to companies in a clean and easy to understand manner.
The purpose of the analytics dashboard app is to obtain necessary information to help retailers and manufacturers to make more informed decisions about product quality and the voice of the customer. In order to do this, we will mine Twitter data because it is rich in unsolicited customer feedback, and it is also timely and cost effective to collect. Specifically, by analyzing tweets we will provide a summary of the overall opinion consumers, compared to existing survey method which is designed to measure customers’ readiness to recommend the product and rates of repurchase. By monitoring changes over time in the ratio of positive to negative tweets, we can assess whether improvements to the products are leading to increased customer satisfaction.
Leave a Reply